
The FXSSI Support and Resistance indicator for Metatrader 5 is a dynamic trading tool designed to identify significant support and resistance levels and display them as rectangular areas on your price chart.
This versatile indicator also provides valuable insights into market behavior by tracking the number of times the price revisits these support and resistance areas.
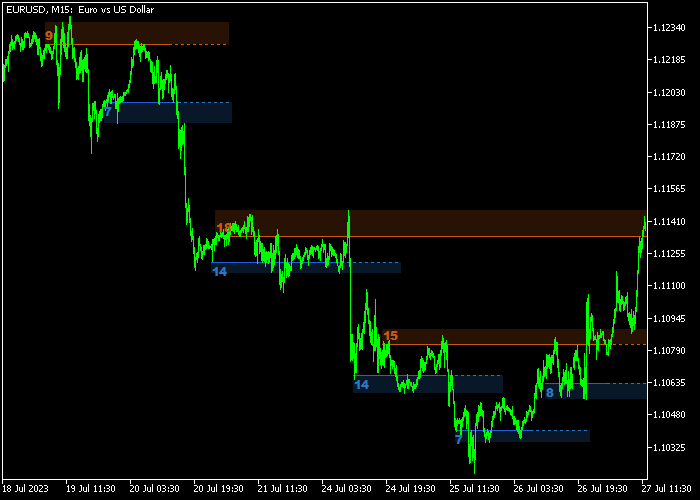
For instance, when the number “8” appears, it signifies that the price has interacted with that specific support or resistance area on eight different occasions.
The indicator supports all time frames and trading instruments offered by your MT5 broker.
Understanding the basics of support and resistance is essential when using this tool:
- A candle closing above a resistance area indicates bullish pressure, implying potential upward momentum in the market.
- A candle closing below a support area suggests bearish pressure, signaling the possibility of downward movement.
The following indicator inputs can be modified: level vertical width, levels frequency on the chart, display options, colors, and more.
Make yourself familiar with this technical indicator and test it first on a demo account until you fully understand how it works.
Download Indicator 🆓
FXSSI SupportResistance.mq5 Indicator (MT5)
Chart Example
The picture below shows what the FXSSI Support and Resistance indicator looks like when applied to the MT5 chart.
How To Buy And Sell Forex Pairs With The FXSSI Support and Resistance Indicator?
Find a simple trading example below:
Buy Signal
- Buy market condition: the primary trend must be upward.
- A buy signal is generated when the candle closes above the rectangular resistance area.
- Open a buy transaction and place a stop loss order below the most recent swing low.
- If the candle fails to close above the next key resistance level after multiple attempts, it is advisable to exit the buy trade at that point.
Sell Signal
- Sell market condition: the primary trend must be downward.
- A sell signal is triggered when the candle closes below the rectangular support area.
- Open a sell transaction and place a stop loss order above the most recent swing high.
- If the candle fails to close below the next key support level after multiple attempts, it is advisable to exit the sell trade at that point.
Download Now 🆓
FXSSI SupportResistance.mq5 Indicator (MT5)
Frequently Asked Questions
How Do I Install This Custom Indicator On Metatrader 5?
- Open the MT5 trading platform
- Click on the File menu button located at the top left part of the platform
- Click on Open Data Folder > MQL5 folder > Indicators
- Copy the FXSSI SupportResistance.mq5 indicator file in the Indicators folder
- Close and restart the trading platform
- You will find the indicator here (Navigator window > Indicators)
- Drag the indicator to the chart to get started with it!
How Do I Edit This Indicator?
- Click on the open chart with your right mouse button
- In the dropdown menu, click on Indicator List
- Select the indicator and click on the properties
- Now you can edit the inputs, colors, levels, scale, and visualization
- Finally, click the OK button to save the new configuration