
The FQ Trend Histogram Signal Forex indicator for MT4 provides trend signals with 70% accuracy.
From our testings, the indicator’s accuracy exceeds 70%, which is quite good.
Key Points:
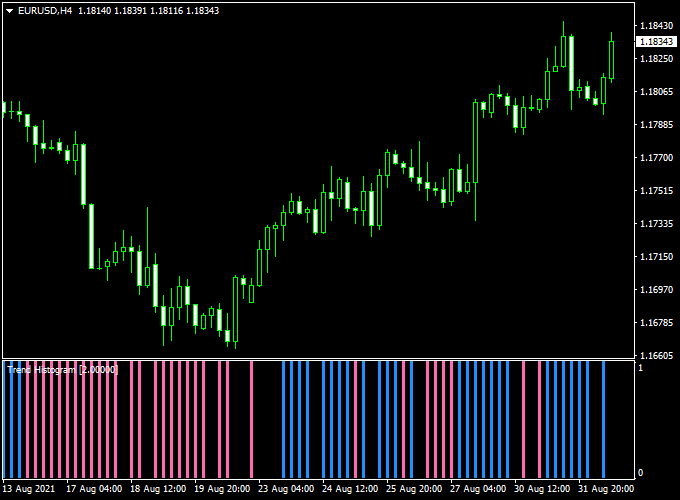
- A blue colored FQ Histogram bar represents a buy trade opportunity.
- A pink colored FQ Histogram bar represents a sell trade opportunity.
Make sure to enable DLL imports when you run the indicator.
Free Download
Download the “$Zalbu_FQ Trend Histogram.ex4” indicator for MT4
Indicator Example Chart (EUR/USD H4)
How to trade with it?
Open a buy trade as soon as the first blue FQ histogram bar gets displayed on the MT4 chart.
Open a sell trade as soon as the first pink FQ histogram bar gets displayed on the MT4 chart.
Naturally, feel free to use your own favorite trading methods to open and close trades with the FQ Trend Histogram Signal Forex indicator .
Indicator Specifications
Trading Platform: Developed for Metatrader 4 (MT4)
Currency pairs: Works for any pair
Time frames: Works for any time frame
Input Parameters: Period, bars to analyze, color settings & style
Indicator type: Histogram signals
Repaint? Does not repaint the blue and red histogram bars.
Download Now
Download the “$Zalbu_FQ Trend Histogram.ex4” indicator for Metatrader 4
Installation:
Open the Metatrader 4 platform
From the top menu, click on “File”
Then click on “Open Data Folder”
Then double click with your mouse button on “MQL4”
Now double click on “Indicators”
Paste the $Zalbu_FQ Trend Histogram.ex4 indicator in the Indicators folder.
Finally restart the MT4 platform and attach the indicator to any chart.
How to remove the indicator?
Click with your right mouse button in the chart with the indicator attached onto it.
Select “Indicator List” from the drop down menu.
Select the indicator and press delete.
How to edit the indicator’s inputs and parameters?
Right click with your mouse button in the chart with the indicator attached onto it.
From the drop down menu, click on indicators list.
Select the indicator from the list and press edit.
Now you can edit the indicator.
Finally, press the OK button to save the updated configuration.