
The Forex Spread Screener dashboard indicator for Metatrader 5 displays the real-time spread for all currency pairs you wish to monitor in a simple dashboard.
The indicator enables you to easily load the currency chart by clicking on the currency pair listed in the dashboard.
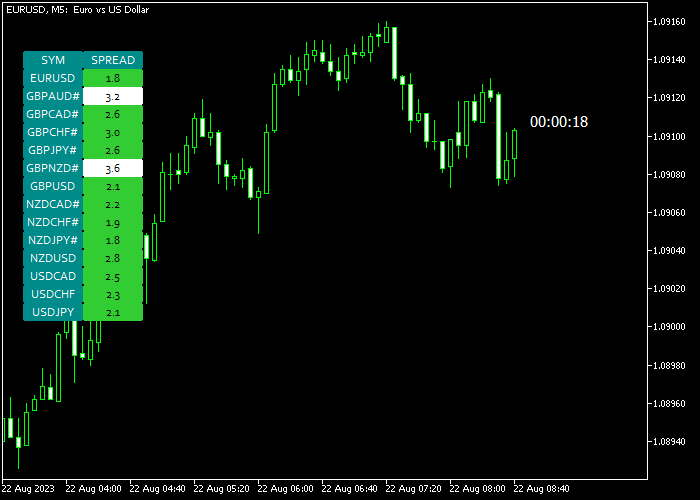
Furthermore, the spread screener also displays the time left until the next candle appears in the price chart.
In the indicators inputs menu, you can add or remove the currency pairs you wish to monitor in real time.
The following indicator variables and parameters can be modified: pairs list, suffix, prefix, display screener, spread high level, spread low level, colors, shift, and box settings.
Please familiarize yourself with the spread screener indicator and test it on a demo account first.
It supports all time frames and trading instruments offered by the Metatrader 5 charting platform.
Download Indicator 🆓
Spread Screener and Candle Timer for MT5.mq5 Indicator (MT5)
Chart Example
The picture below shows how the Forex Spread Screener dashboard indicator looks when applied to the MT5 chart.
How To Buy And Sell Currency Pairs With The Candle Timer + Spread Indicator?
The Forex Spread Screener indicator for MT5 does not generate trading signals.
Please use it together with signal indicators or an existing trading strategy of your preference.
Download Now 🆓
Spread Screener and Candle Timer for MT5.mq5 Indicator (MT5)
Frequently Asked Questions
How Do I Install This Custom Indicator On Metatrader 5?
- Open the MT5 trading platform
- Click on the File menu button located at the top left part of the platform
- Click on Open Data Folder > MQL5 folder > Indicators
- Copy the Spread Screener and Candle Timer for MT5.mq5 indicator file in the Indicators folder
- Close and restart the trading platform
- You will find the indicator here (Navigator window > Indicators)
- Drag the indicator to the chart to get started with it!
How Do I Edit This Indicator?
- Click on the open chart with your right mouse button
- In the dropdown menu, click on Indicator List
- Select the indicator and click on the properties
- Now you can edit the inputs, colors, levels, scale, and visualization
- Finally, click the OK button to save the new configuration