
The Adaptive Market Level Forex indicator for Metatrader 4 is a signals indicator based on Fractals + lagging filter.
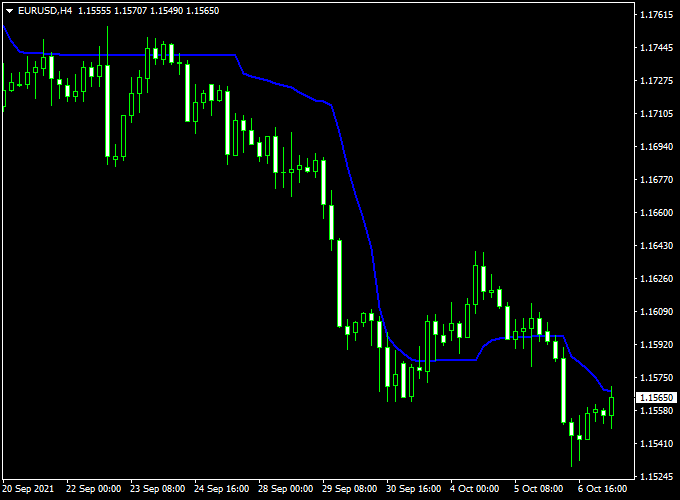
After loading the Adaptive Market Level Forex indicator on the chart, the blue signal line will appear on the main trading chart.
From the indicator’s inputs, you can edit the both the Fractal and lag period.
Key Points:
- Price above the Adaptive Market Level blue line is considered bullish.
- Price below the Adaptive Market Level blue line is considered bearish.
Free Download
Download the “adaptive-market-level.mq4” indicator for MT4
Indicator Example Chart (EUR/USD H4)
How to trade with it (example)?
Open a buy position whenever price crosses the blue signal line upwards.
Open a sell position whenever price crosses the blue signal line downwards.
Exit the trade for a fixed profit target, for example, 20 pips on the 5-minute chart, or wait for an opposite trading signal.
Feel free to use your own favorite trading method to open and close trades with the Adaptive Market Level indicator.
Indicator Specifications
Trading Platform: Developed for Metatrader 4 (MT4)
Currency pairs: Works for any pair
Time frames: Works for any time frame
Input Parameters: Fractal, lag, color settings & style
Indicator type: Fractal
Repaint? Does not repaint the blue adaptive market level line.
Download Now
Download the “adaptive-market-level.mq4” indicator for Metatrader 4
Installation:
Open the Metatrader 4 platform
From the top menu, click on “File”
Then click on “Open Data Folder”
Then double click with your mouse button on “MQL4”
Now double click on “Indicators”
Paste the adaptive-market-level.mq4 indicator in the Indicators folder.
Finally restart the MT4 platform and attach the indicator to any chart.
How to remove the indicator?
Click with your right mouse button in the chart with the indicator attached onto it.
Select “Indicator List” from the drop down menu.
Select the indicator and press delete.
How to edit the indicator’s inputs and parameters?
Right click with your mouse button in the chart with the indicator attached onto it.
From the drop down menu, click on indicators list.
Select the indicator from the list and press edit.
Now you can edit the indicator.
Finally, press the OK button to save the updated configuration.