The ADX with Moving Averages Forex indicator that runs on the Metatrader 4 platform is an excellent trend trading indicator that works well for all currency pairs.
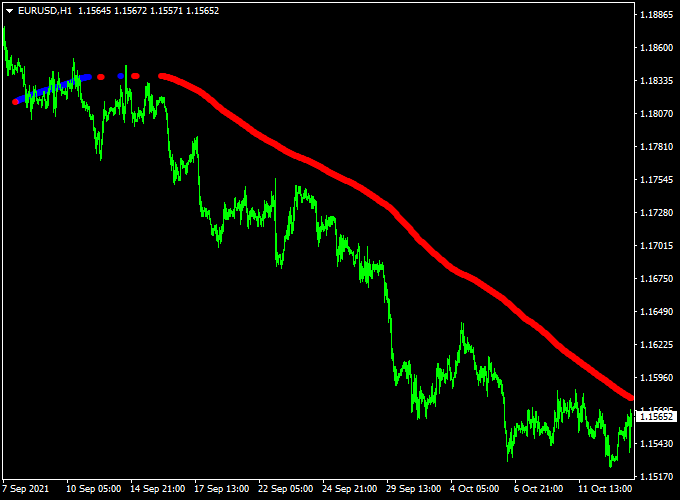
The indicator appears in the form of a colored blue/red signal dotted line on the chart.
Trading with this indicator is simple:
- The trend is considered upwards when the dots are colored blue.
- The trend is considered downwards when the dots are colored red.
The indicator works on all trading instruments (Forex, CFD stocks, Indices, Cryptocurrencies, Commodities,..).
Free Download
Download the “adx-ma.ex4” indicator for MT4
Indicator Example Chart (EUR/USD H1)

How to trade with it (example)?
Consider to open a buy position as soon as the first blue colored dot appears on the chart.
Consider to open a sell position as soon as the first red colored dot appears on the chart.
Exit the trade for a fixed profit target, or when an opposite trading signal appears on the chart.
Place a stop loss above or below the previous swing high/low price.
Feel free to use your own favorite trading method to open and close trades with the Advanced ADX Forex indicator.
Indicator Specifications
Trading Platform: Developed for Metatrader 4 (MT4)
Currency pairs: Works for any pair
Time frames: Works for any time frame
Input Parameters: MA period, cross over threshold, count bars, color settings & style
Indicator type: signals
Repaint? Does not repaint the colored signal dots.
Download Now
Download the “adx-ma.ex4” indicator for Metatrader 4
Installation:
Open the Metatrader 4 platform
From the top menu, click on “File”
Then click on “Open Data Folder”
Then double click with your mouse button on “MQL4”
Now double click on “Indicators”
Paste the adx-ma.ex4 indicator in the Indicators folder.
Finally restart the MT4 platform and attach the indicator to any chart.
How to remove the indicator?
Click with your right mouse button in the chart with the indicator attached onto it.
Select “Indicator List” from the drop down menu.
Select the indicator and press delete.
How to edit the indicator’s inputs and parameters?
Right click with your mouse button in the chart with the indicator attached onto it.
From the drop down menu, click on indicators list.
Select the indicator from the list and press edit.
Now you can edit the indicator.
Finally, press the OK button to save the updated configuration.